Openrocket is excellent and it’s fantastic to have opensource tools to design rockets and then simulate them in flight. The simulation aspect relies not only on the rocket design but also on good data being available for the rocket motor you wish to simulate. Openrocket has a built in database of RASP/.eng motor files for many common motors. If you are using an Estes for example then you are pretty much assured to find it in the database to run your simulation. What can we do though if our motor isn’t available in the database.
Well a first solution would be to see if there is a RASP/.eng file for your motor anywhere online. Starting off at the manufacturers site and then perhaps perusing through a few forums to see of you can search it out. Recently though I was looking at a new and pretty unknown motor here in the UK, the TSP E20, and I couldn’t find a file for it anywhere.

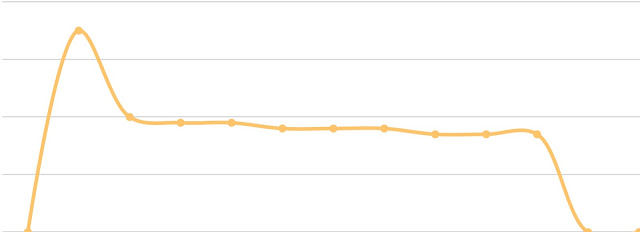
What I could find though were thrust curve diagrams for the motor provided by the manufacturer. I then recalled that there was a piece of software that purportedly could trace over a thrust curve image and create the file I needed. The piece of software that can do this is a small Java application called TCTracer and it’s available over on the Thrustcurve site. It’s available for a range of operating systems including windows Mac and Linux and it installed flawlessly on my Arch Linux machine.

With that installed and the image of the target motors thrust curve diagram (a screenshot will do) we can create our motor file. You first import the image into the TCTracer application. As a side note I first trimmed my screenshot image with the wonderful free and opensource GIMP image editor. Whilst trimming made it slightly easier you can scale the grid in TCTracer to accurately place the grid range over your image regardless of what extra imagery is on the page.
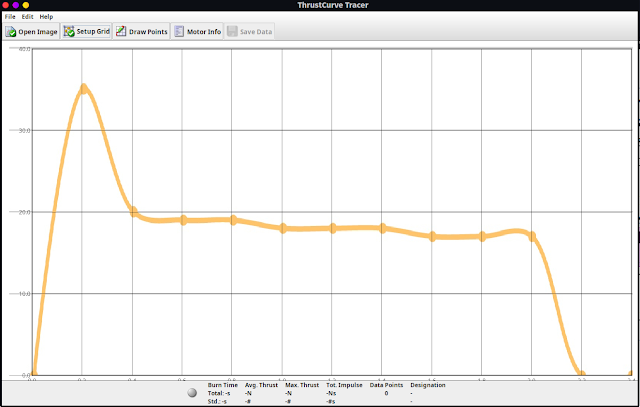
Next in TCTracer click the “Setup Grid” button. You should see a small dialogue box “Grid Overlay which needs some details adding. First of all is the X axis start and end points in seconds. Most of the time you will want to start at 0 seconds and for our TSP E20 motor the curve chart data was logged till 2.4 seconds with a marker line at every 0.2 seconds. So we set the X axis at 0 to 2.4 seconds. The next line is the sub divisions of the X axis. Counter intuitively this isn’t expecting a value in seconds, it requires a whole number value that represents the number of subdivisions between the start and end point. In reality you can actually leave this empty or place “1” in there as you don’t strictly need the subdivisions, but it can be nice to make everything match up well visually. For our example we added “11” which means our 2.4 seconds contained the correct amount to place a subdivision marker at every 0.2 seconds. The last two lines are similar for the Y axis, you select the maximum height value and then the number of subdivisions. Our thrust curve diagram had a Y axis scale up to 40N in increments of 10N, even though the motor topped out at a little over 36N. So we set the Y axis as 0 to 40, the number of sub divisions to be 3 and set the units to Newtons using the drop down menu. Finally you need to drag the grid lines to align them with your image, note that you align them to the image chart lines and not the peak of the curve.
Next click the “Draw Points” button. You can then trace over the curve in your image. You don’t need to place a point at the zero time point rather just start clicking the line to trace over it. At the end of the thrust curve you definitely need one point to have returned to zero thrust or else you will have a small error indicator at the bottom of the page. To undo a misplaced trace point simply left click on it again to make it disappear.

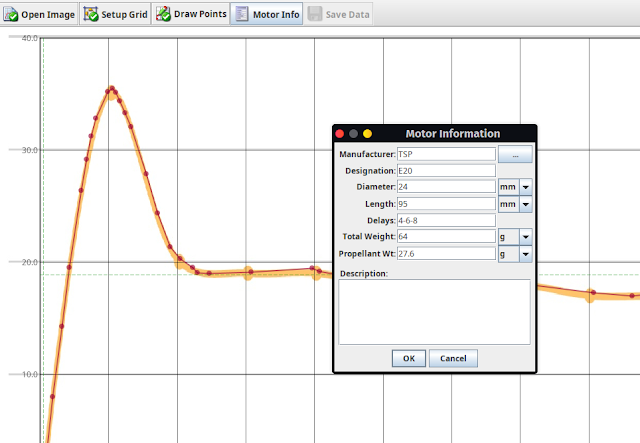
The final part of the process is to click the “Motor Info” button and in the Motor Information dialogue add the details of the motor. This is a largely straightforward if you have the data about the length and the weights of both the complete motor and the propellant. To add a choice of ejection delays you can add the value in seconds followed by a “-” so for example 4-6-8 in the delays section of the motor info dialogue will allow you to switch between a 4, 6 or 8 second delay in Openrocket. With all your motor information added click OK. Finally click the “Save Data” tab/button and save the .eng file.
In Openrocket you need to provide a path to where you have stored your .eng files. To do this in openrocket click “Edit” and then “Preferences”. On the main preferences dialogue box there is a section titled “user defined thrust curves” click the “add” button in this section and navigate to the folder/directory holding your .eng files and then click the new “add” button. I’ve found I need to then close and reopen Openrocket to set up the path correctly. Now if I go into select a motor I have the TSP E20 with various delays available to select for simulation.
Massive kudos to John Coker who created TCTracer and maintains the Thrustcurve.org site.


